Explanation:
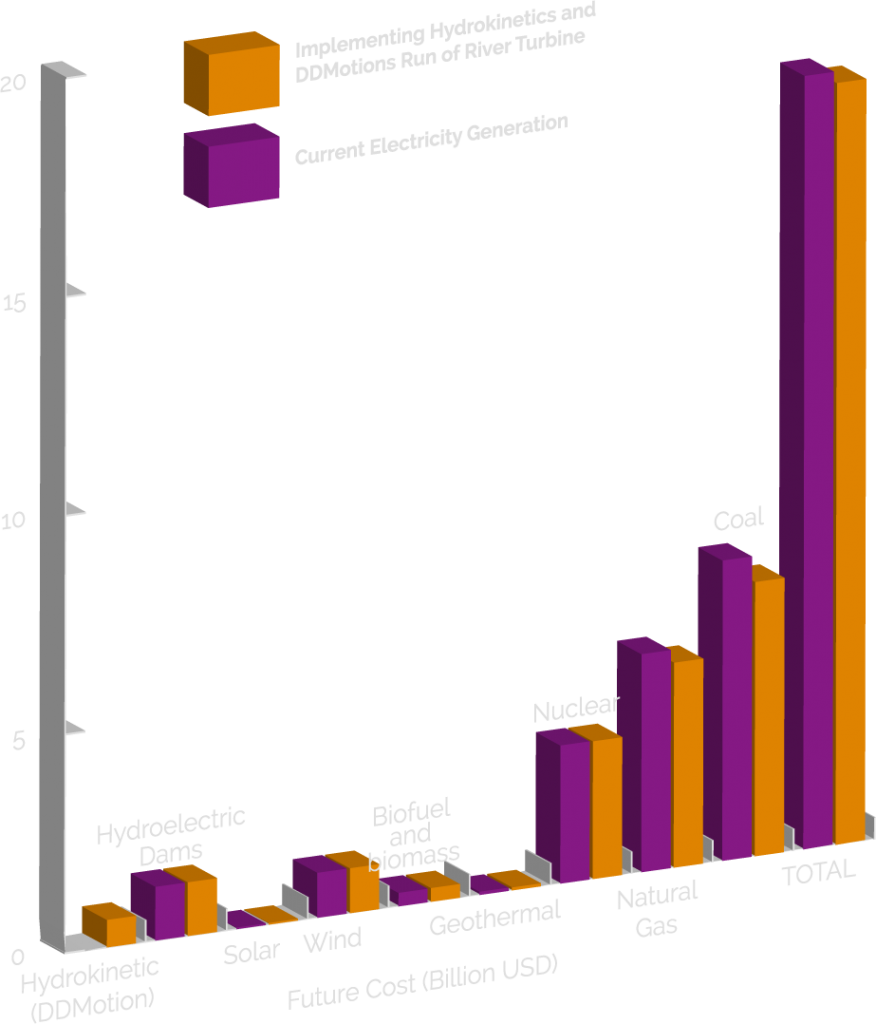
This chart shows estimates of how much money the US estimates to spend on current energy resources from 2012 and projected to 2040. The purple color shows the US spend if there are no changes. The orange color shows DDMotion’s river turbine securing 10% of the electricity market, offsetting a combined 10% of coal and natural gas. This will lower the US dependency on resources with high carbon emissions. The DDMotion river turbine cost is less per kWh and will reduce harmful emissions produced by carbon-based resources. The number of river turbines can be increased due to more rivers and more available sites. As a result, the emissions can be reduced considerably.
Source: These values are derived from a combination of the US Levelized costs of energy by source chart, and market percentages of each energy source.